This article guides you through Smartlead’s Campaign Dashboard—your central hub for monitoring the health of your email campaigns.
You’ll learn how to:
Navigate to the Campaign Dashboard and understand its layout.
Switch between All Campaigns and Folders views.
Use filters and search to find the campaigns you care about.
Customize which metrics (columns) appear in the report table.
Interpret key performance metrics like open rates, reply rates, and bounces.
Follow recommended practices and avoid common pitfalls.
Troubleshoot issues and find answers to frequently asked questions.
Before using the Campaign Dashboard, make sure you:
Have an active Smartlead workspace and the necessary permissions to view and manage campaigns.
Create at least one email campaign. If you don’t see any data, start by creating a new campaign under Email Campaigns.
Know your metrics terminology: Sent refers to the total emails sent; Opened counts unique opens; Replied shows total replies; Positive Reply counts replies marked with a positive sentiment; Bounced counts emails returned to the sender; Sender Bounced refers specifically to bounces from your sending address.
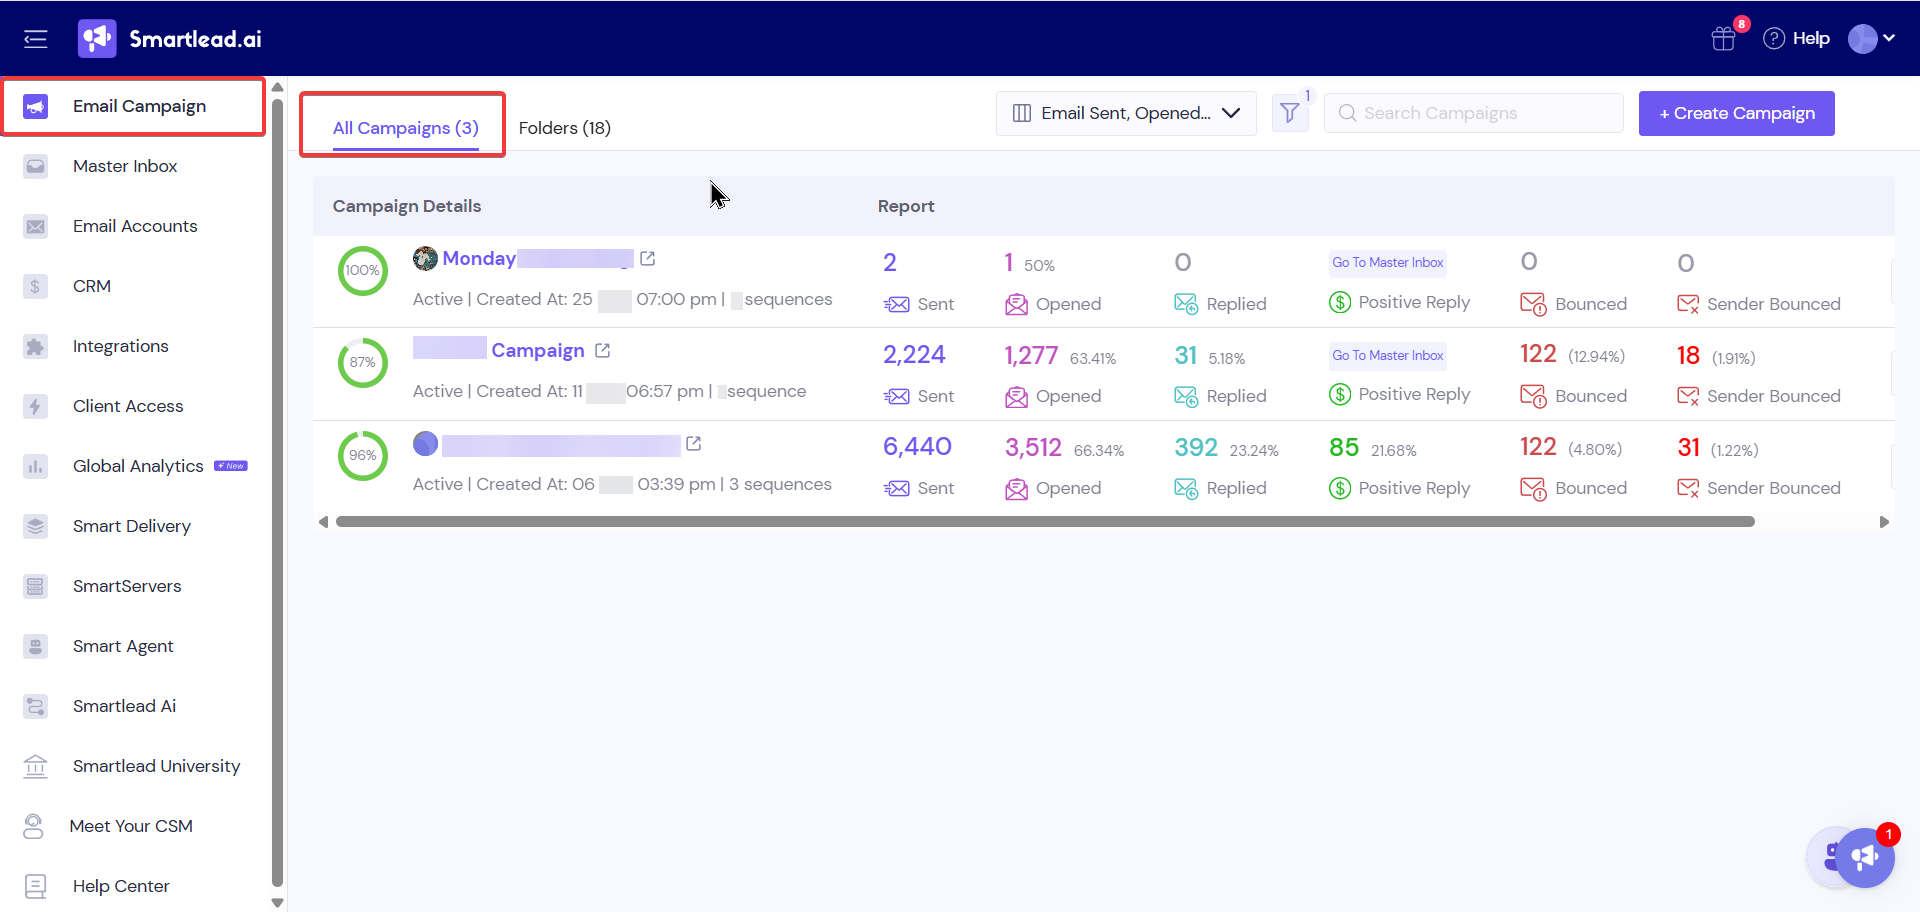
Log in to Smartlead and select Email Campaign from the left navigation bar. This opens the Campaign Dashboard, where you’ll see a list of your campaigns and key performance metrics.
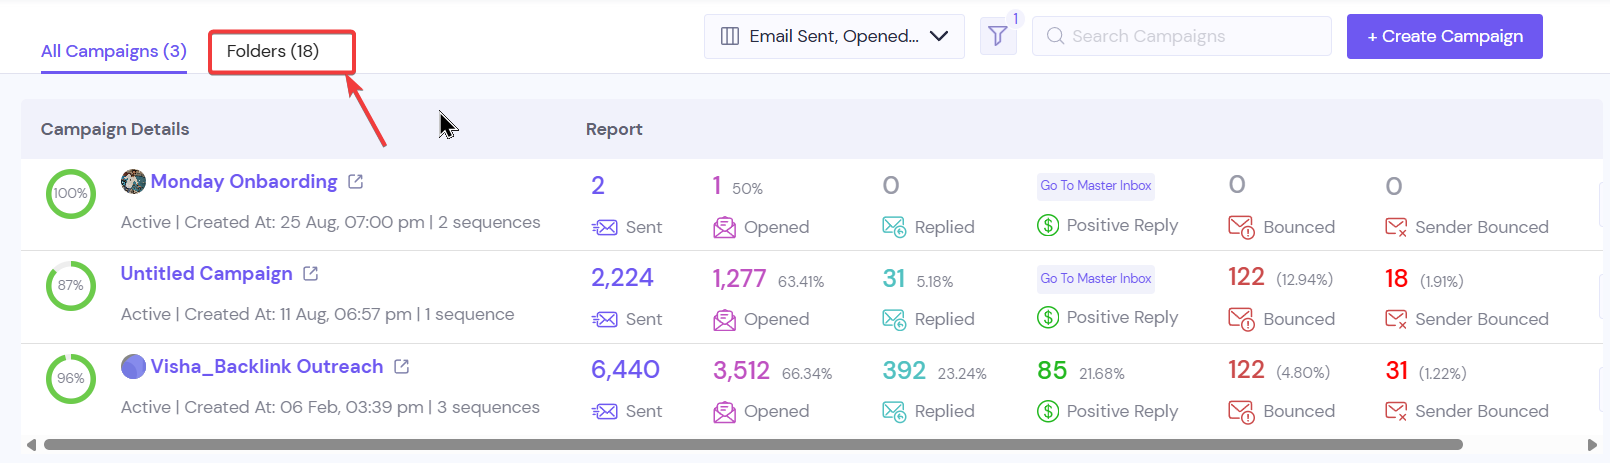
At the top of the page, two tabs let you toggle between All Campaigns (showing every campaign you have access to) and Folders (where campaigns can be grouped). The active tab is highlighted in purple.
The Campaign Dashboard is designed to give you high‑level insights at a glance. Familiarize yourself with these components:
Navigation panel: Located on the left, this panel lets you jump between Email Campaigns, Master Inbox, Email Accounts, CRM, Integrations, and other modules. The highlighted item indicates your current section.
Top bar: At the top of the dashboard, you’ll find:
A column selector drop‑down (table icon) to choose which metrics are displayed.
A filter button (funnel icon) to narrow campaigns by status, tag, or client name.
A search bar that lets you search campaigns by name.
A Create Campaign button for quickly starting a new campaign.
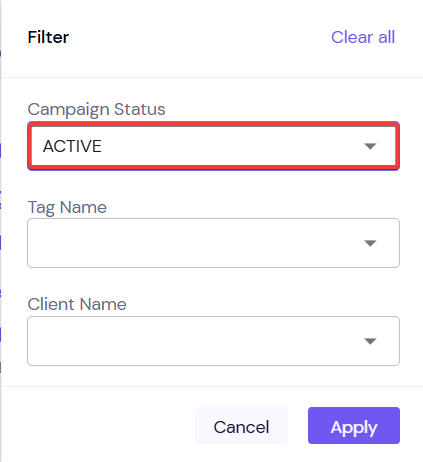
Filter by status, tag, or client: Select the funnel icon to open the filter panel. You can filter campaigns by Campaign Status (e.g., Active, Paused), Tag Name, or Client Name. Selecting a status will restrict the list to only those campaigns. Choose Apply to confirm or Clear all to reset filters.
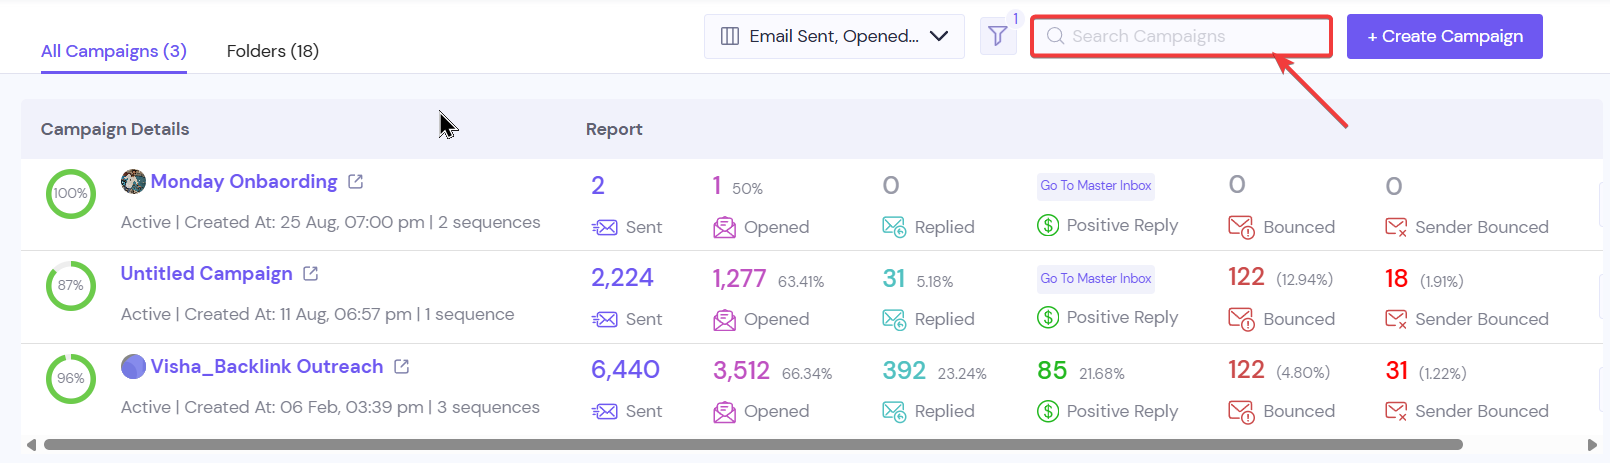
Search for a campaign: Use the search bar to quickly find a campaign by its name. Start typing and the list will update dynamically to match your search.
Sort or scroll: Columns such as Sent, Opened, and Replied can be sorted by selecting their headers. If your table has many columns, use the horizontal scroll bar at the bottom to view all metrics.
Smartlead allows you to select which metrics appear in your report table. To customize columns:
Select the column selector (table icon) on the top bar.
In the Column Customization panel, select or deselect metrics such as Leads, Email Sent, Opened, Clicked, Replied, Positive Reply, Bounced, and Sender Bounced. Checked items will appear as columns in your report table.
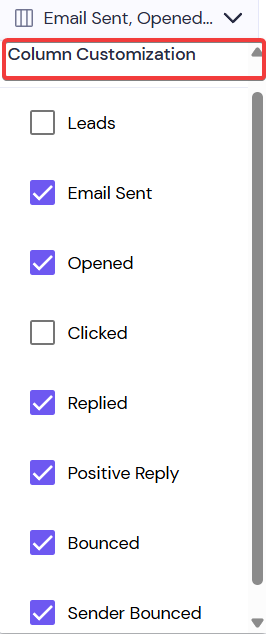
Close the panel or click anywhere outside it to apply your selections. Your table will immediately update to reflect the chosen metrics.
Metric | Description | Calculation |
Email Sent | Total number of emails sent across all sequences. | Sum of all emails sent (e.g., if 100 leads receive sequence 1 and 20 leads receive sequence 2, the count is 120). |
Opened | Number of unique recipients who opened at least one email. | Unique opens across all sequences (multiple opens by the same person count once). |
Open Rate | Percentage of leads who opened an email. | (Unique opens ÷ number of leads emailed) × 100. |
Clicked | Total number of link clicks. | Counts every click across all sequences (if one lead clicks links in all sequences, each click is counted). |
Click Rate | Percentage of recipients who clicked a link. | (Unique clicks ÷ unique opens) × 100. |
Replied | Total number of replies across all sequences. | Each reply is counted; multiple replies from the same lead count individually. |
Reply Rate | Percentage of recipients who replied. | (Total replies ÷ unique opens) × 100. |
Positive Reply | Number of replies categorized as positive in the Master Inbox. | Replies marked with a positive sentiment label. |
Positive Reply Rate | Portion of replies that are positive. | (Positive replies ÷ total replies) × 100. |
Bounced | Emails that were returned by the recipient’s mail server. | Usually indicates invalid addresses or temporary delivery issues. |
Sender Bounced | Emails bounced by the sender’s domain. | Often due to sending limits or misconfigured DNS records (e.g., missing SPF/DKIM). |
Tip: If you see a Go to Master Inbox link in the Positive Reply column, select it to jump directly to the Master Inbox view for that campaign and review the actual conversations.
If you manage many campaigns, grouping them into folders keeps things tidy:
On the dashboard’s top left, select Folders next to All Campaigns to switch to the folders view. Here you can create new folders or browse existing ones.
Move campaigns into a folder by editing the campaign settings (open the campaign and choose a folder). Only the campaigns in the selected folder will appear when that folder is active.
Regularly review your metrics: Check open, click, and reply rates after each sequence to understand how leads are engaging. Use this data to adjust your messaging or sequencing.
Leverage tags and clients: Tag your campaigns (e.g., by product line, region or experiment) and assign a client when relevant. This makes filtering and reporting easier.
Customize your view: Show only the metrics that matter for your current analysis. For example, if click tracking isn’t relevant, hide the Clicked column to reduce clutter.
Investigate bounces: Monitor the Bounced and Sender Bounced columns. Frequent bounces may indicate list quality issues or problems with your sender setup. Fix these promptly to protect your deliverability.
Use folders for organization: Group related campaigns (e.g., onboarding series or promotional blasts) into folders to keep your dashboard manageable.
Don’t ignore low open rates: Low unique opens may indicate issues with subject lines or sender reputation. Test different subject lines and verify your domain authentication (SPF/DKIM/DMARC).
Avoid overcrowded dashboards: Displaying every metric at once can be overwhelming. Start with a few core metrics and add others only when needed.
Don’t neglect positive replies: Positive replies are opportunities. Use the Go to Master Inbox link to follow up promptly and nurture those leads.
Don’t overlook sender bounces: Sender bounces usually stem from misconfigured DNS or sending too many emails from one mailbox. Address these issues before they impact deliverability.
Double‑check your filters: an Active status filter will hide Paused or Completed campaigns. Click Clear all in the filter panel to reset.
Make sure you’re on the correct tab: switching to Folders can reveal campaigns stored in a specific folder.
Confirm your permissions: You may not see campaigns created by other workspace members if you lack access.
Metrics update in near-real time, but there may be a short delay. Refresh the page after a few minutes.
Ensure that tracking pixels and link redirects are enabled in your sequences; disabling these will prevent open or click tracking.
Review your lead list for typos or outdated addresses and remove invalid emails.
Verify that your sending domain has correct SPF, DKIM and DMARC records. Sender bounces often relate to misconfigured domains.
Space out your sends: sending large batches in a short time can trigger spam filters. Stagger sends to maintain a good sender reputation.
Q: What’s the difference between Bounced and Sender Bounced?
A: Bounced emails are rejected by the recipient’s mail server—usually due to invalid addresses or full inboxes. Sender Bounced emails are rejected by your own sending server or domain (e.g., because sending limits were exceeded or DNS records aren’t set up correctly). Both types of bounces affect deliverability but have different root causes.
Q: How are open rates calculated if recipients receive multiple sequences?
A: Open rates use unique opens across all sequences. If a lead opens multiple emails within a campaign, they’re counted once. Open rate percentage equals unique opens divided by the number of leads that received at least one email.
Q: Why is my Positive Reply count low?
A: Only replies categorised with a positive sentiment in the Master Inbox count here. Make sure to tag replies appropriately. If you’re not receiving replies, review your content and ensure your calls to action are clear.
Q: Can I export the dashboard metrics?
A: Yes, open a campaign and use the export options to download detailed reports. You can also use Smartlead’s API for custom reporting.
Related articles
By following this guide, you’ll have a clear view of your campaigns’ performance.