Smartlead's newly revamped Global Analytics is here. Now you can get deeper and more actionable insights like enhanced filtering and real-time tracking to optimize email outreach. With faster load times, unlimited campaign tracking, and advanced segmentation options, users can now analyze performance across 365 days, monitor client and team performance, and gain detailed insights into ESP, mailbox, and campaign metrics.
In your Smartlead Global Analytics dashboard, it is now essentially divided into two major tabs - Agency Insights and Performance Metrics.
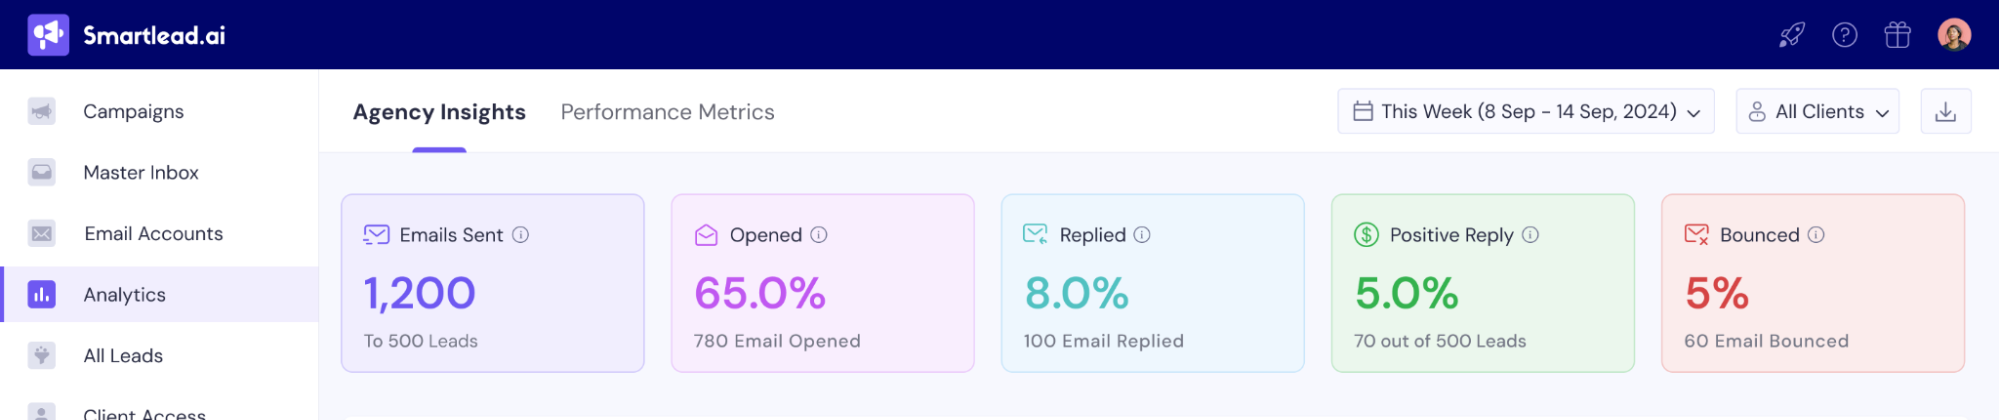
Once you come to the Agency Insights tab, the first row shows you the overview of:
Leads Contacted
Emails Sent
Emails Opened
Emails Replied
Positive Reply
Bounced Emails
Once you scroll down, you can see Total Active Clients and Clients Growth Overview where you can see the number of clients and how the number is growing month on month. And the next one is Overall Client Performance.
This section essentially helps you get a centralized view of your clients. You can view Client Health, Open Rate, Reply Rate, Positive Rate, and Leads Contacted. Thai gives you an overview of how each of your clients’ campaigns are performing.
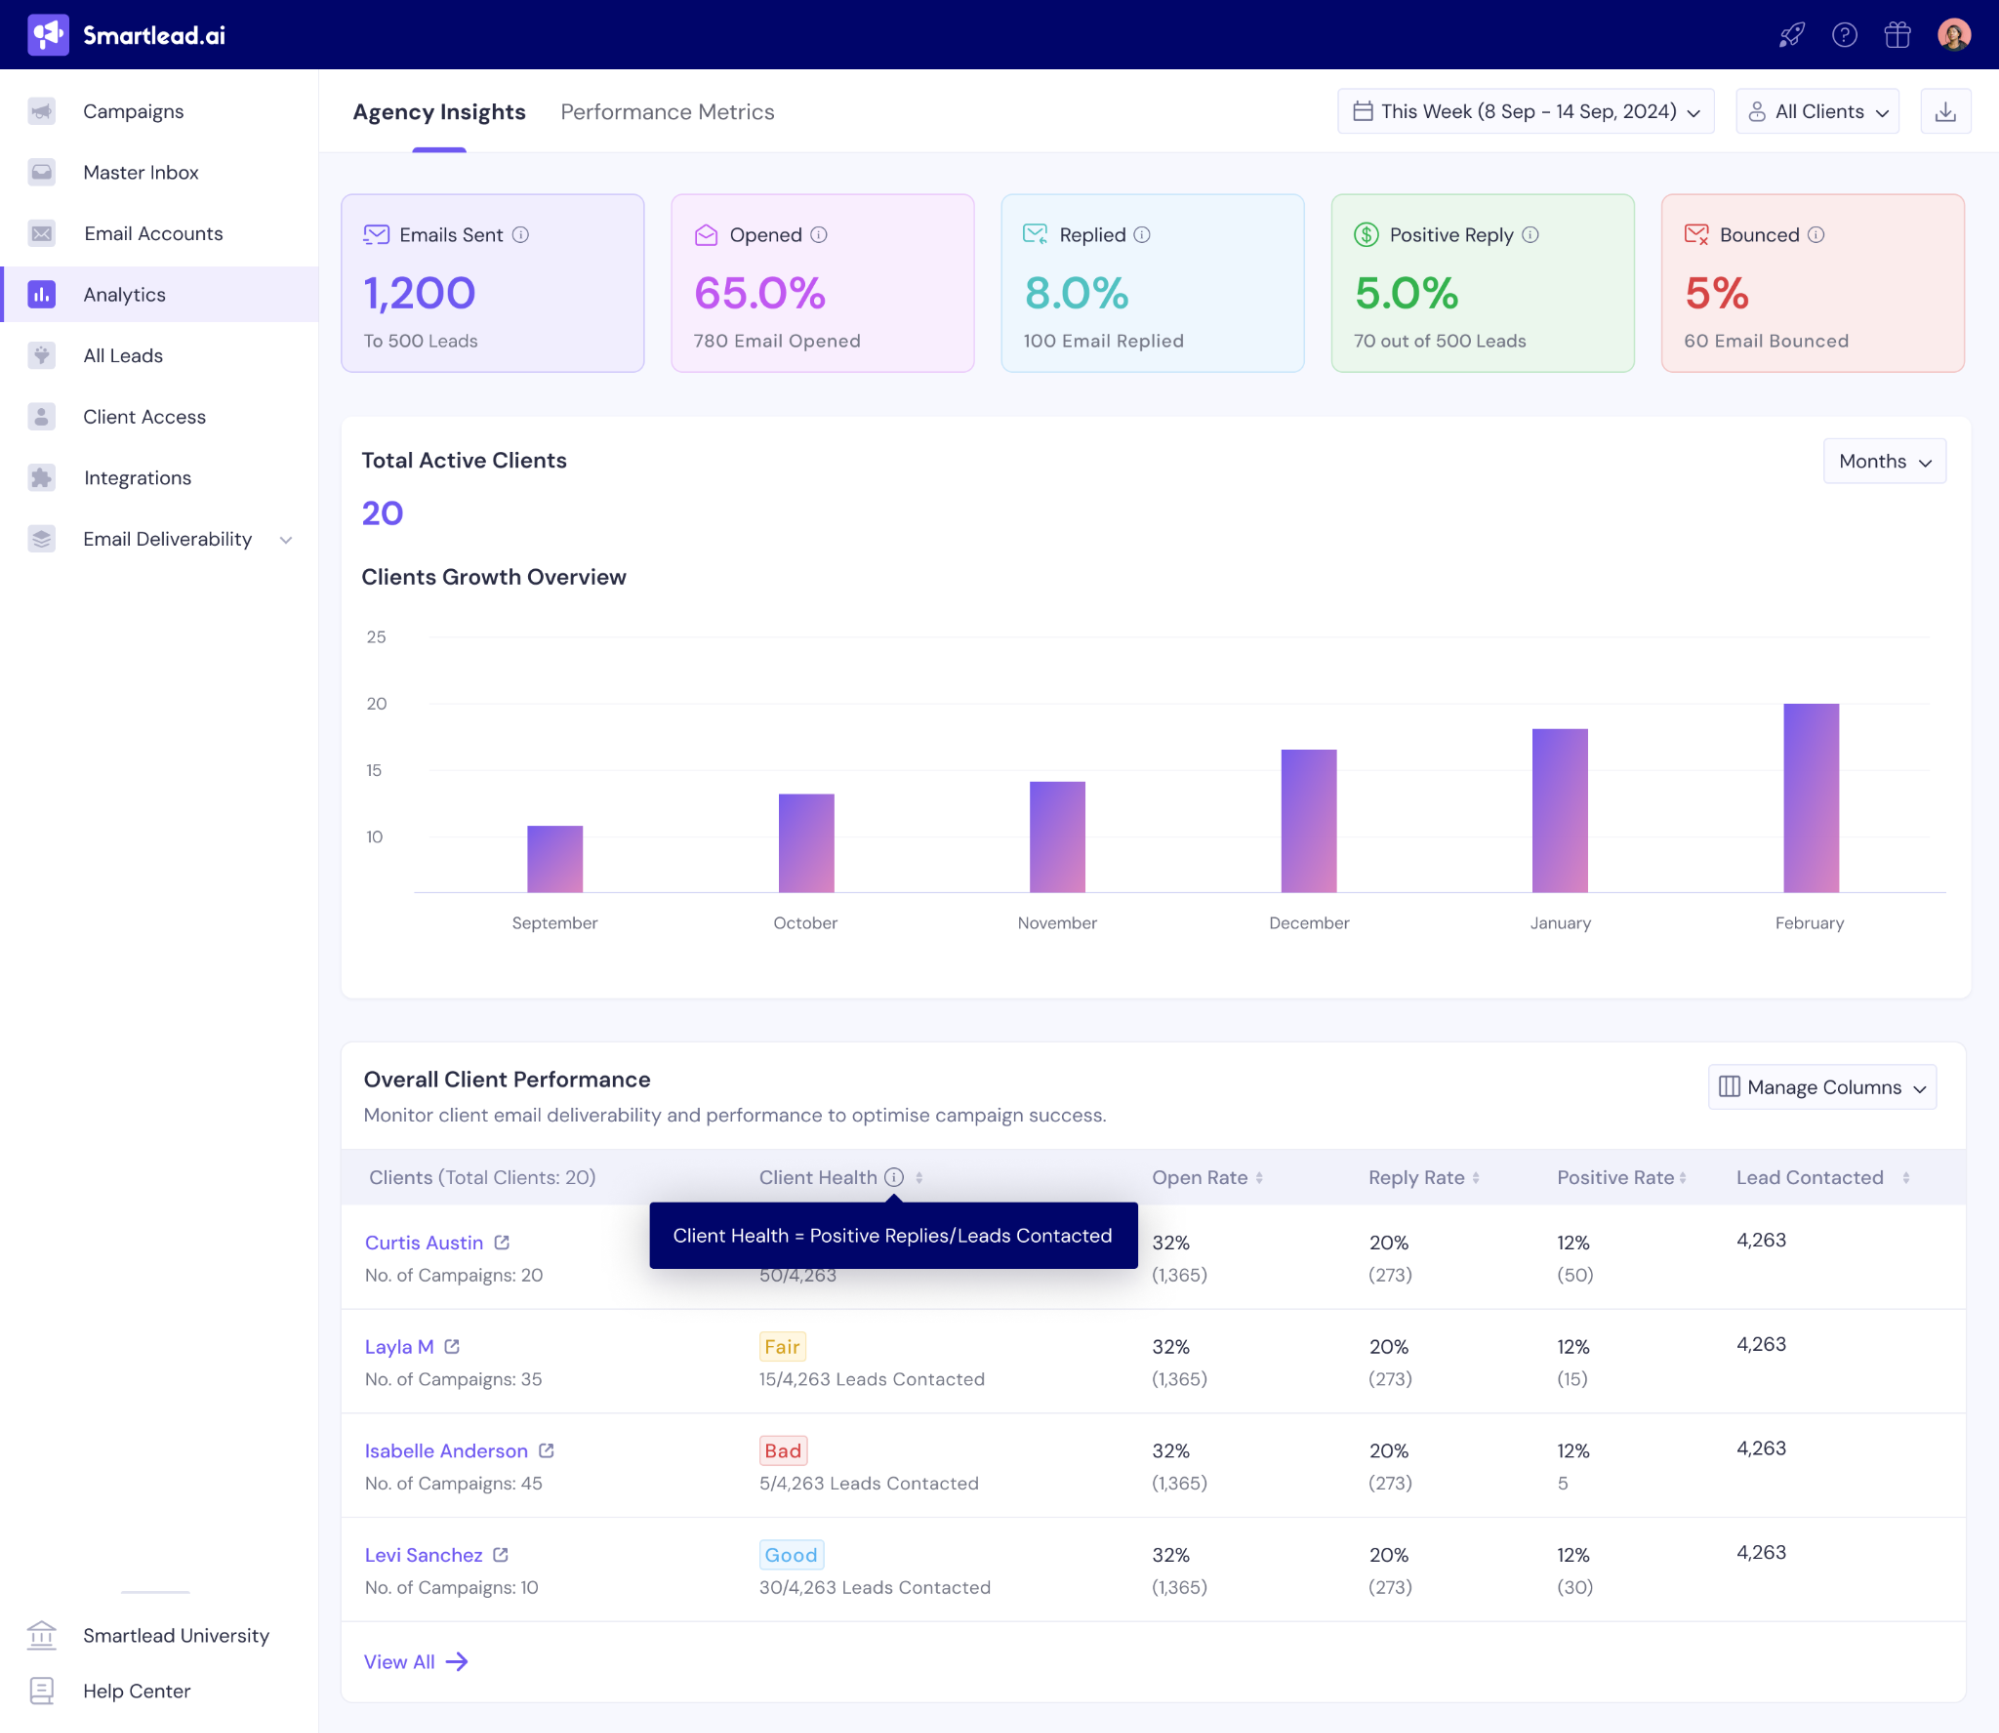
You can also check a particular client’s detailed information by clicking on the particular client’s row.
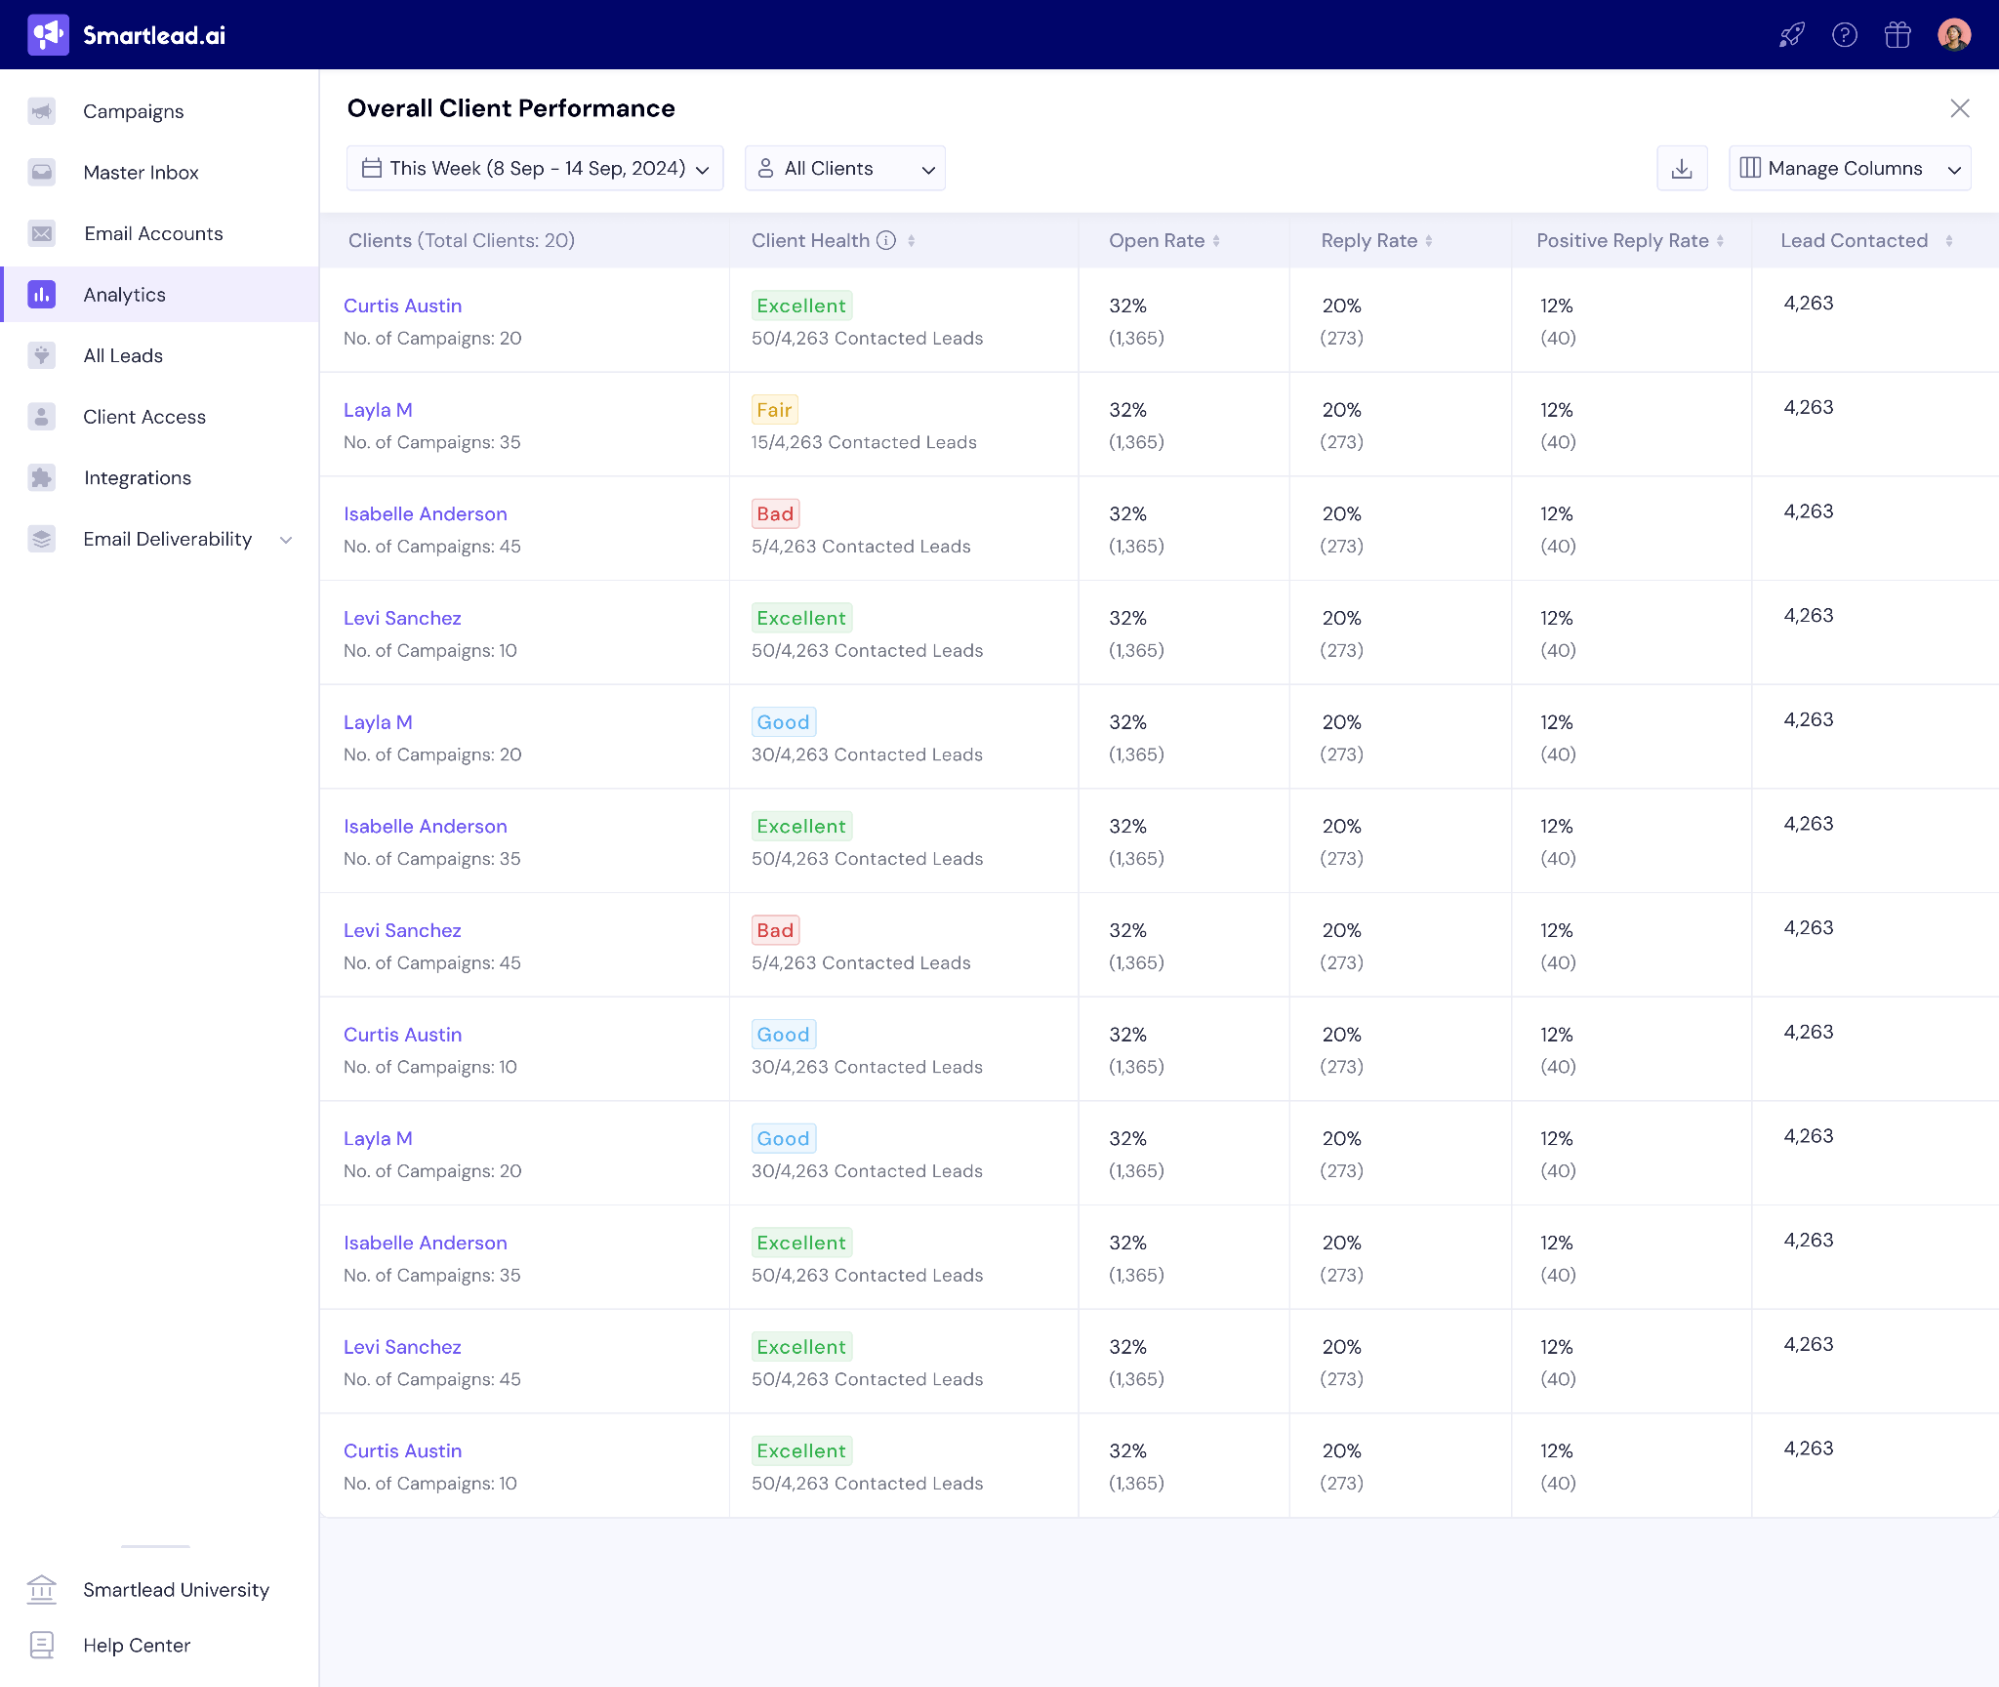
On the last row, you can click on view all, and you will be redirected to the Overall Client Performance page.
The Performance Metrics view is available for all Smartlead customers.
The first row, similar to the first row on Agency Insights, shows you insights about:
Leads Contacted
Emails Sent
Emails Opened
Emails Replied
Positive Reply
Bounced Emails
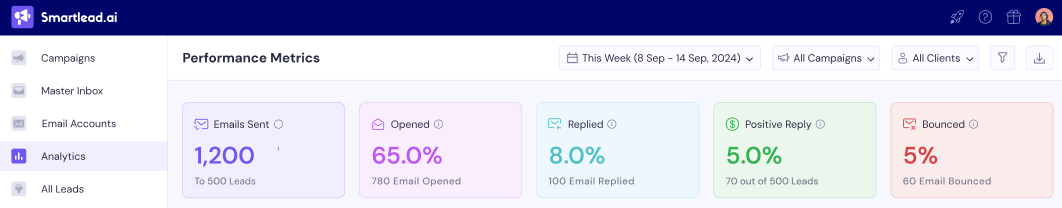
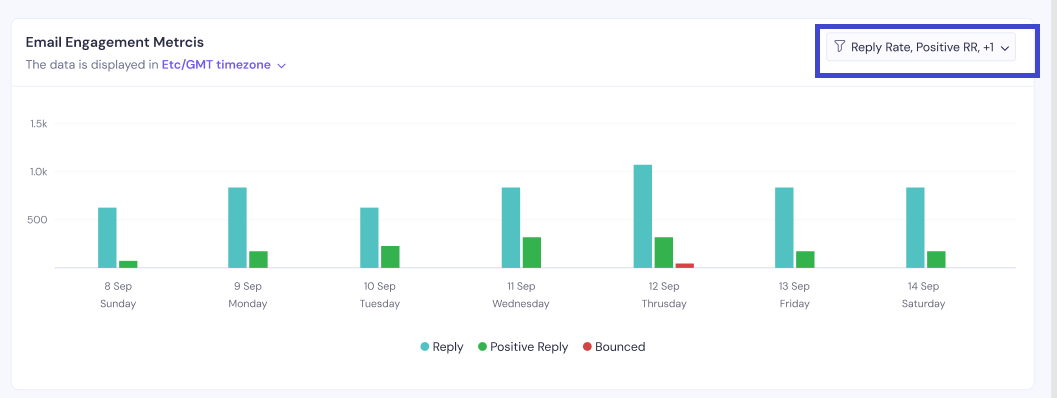
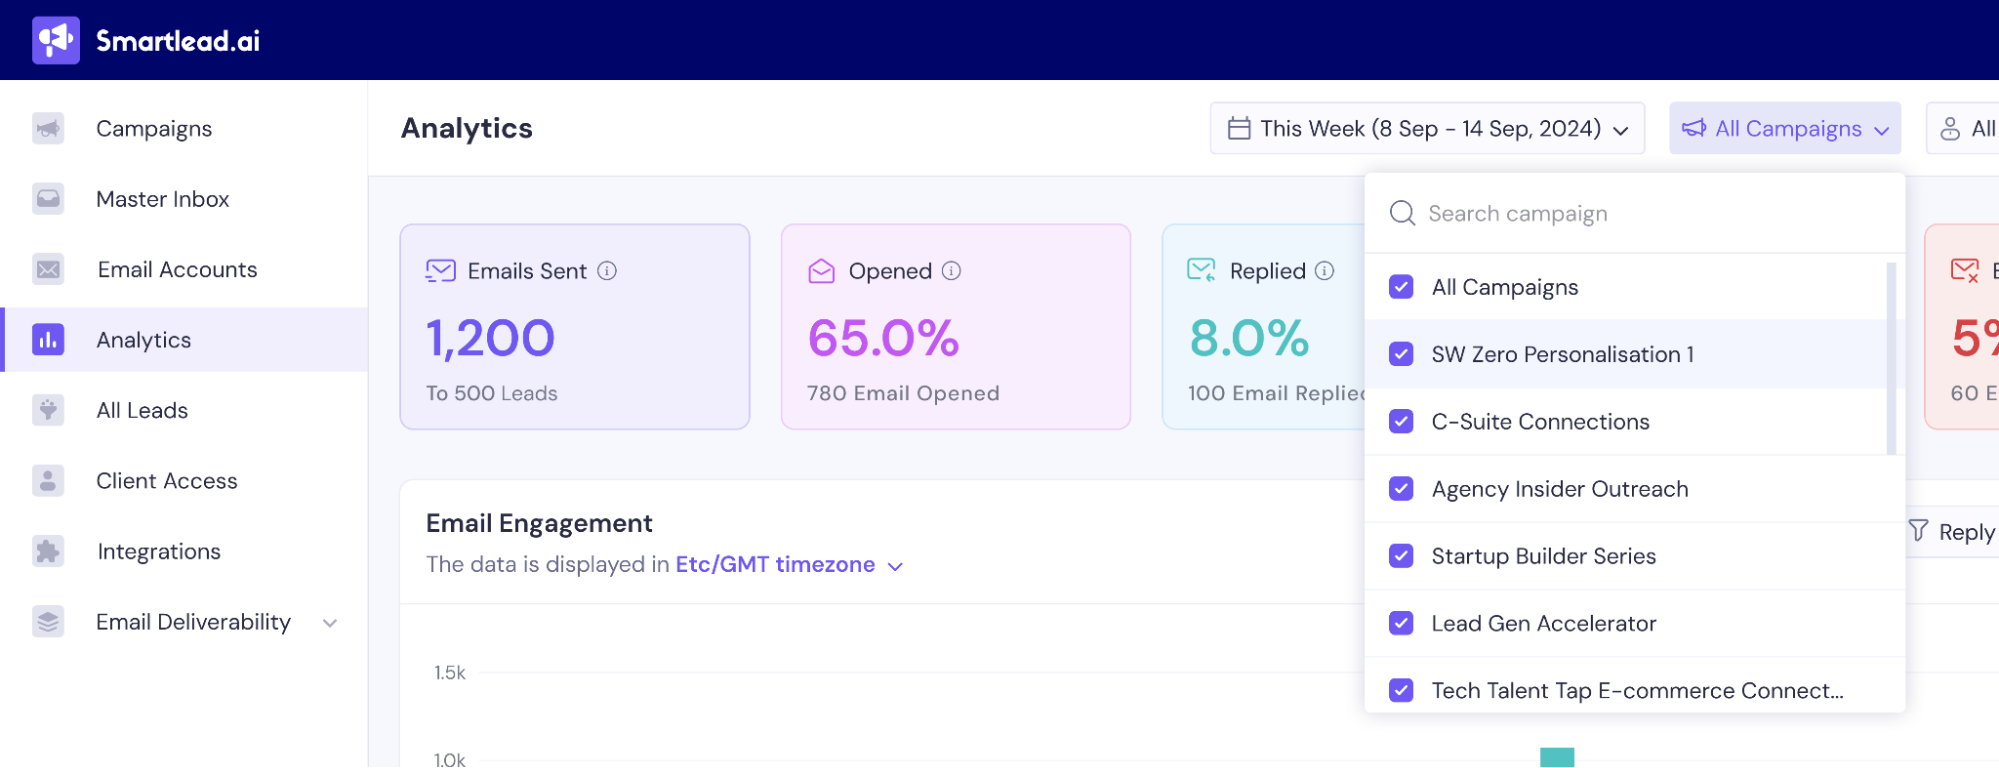
Along with that, on the Performance metrics tab, you get Email Engagement Metrics, where you can see how many emails you have sent, reply rate, positive reply rate, and bounced emails.
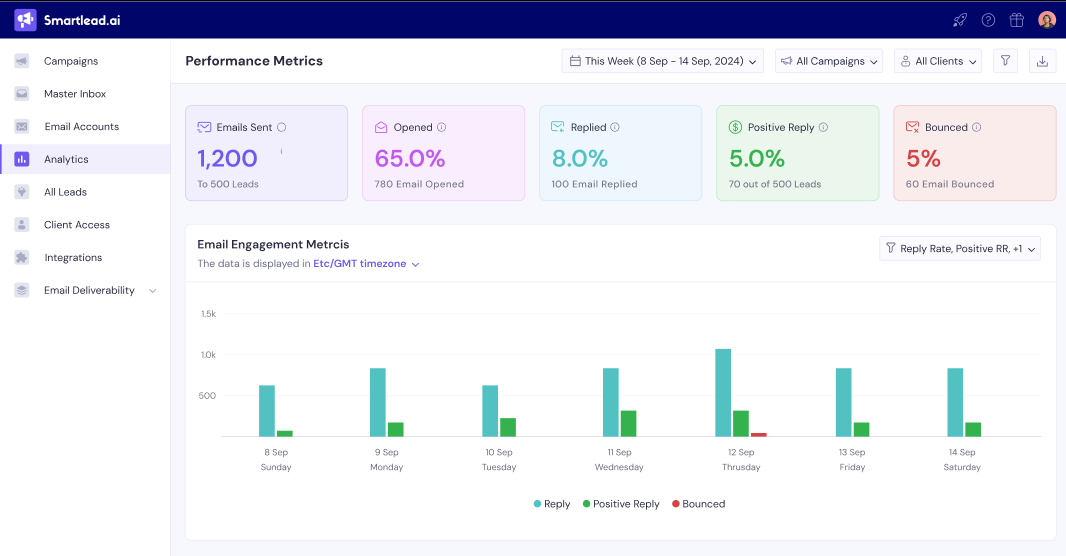
You can also change your view here by using the filter on the corner right of the UI.
Scrolling down, in the next section, you get Lead Stats, where you can check the total number of leads contacted, including follow ups and new leads contacted.
On the lead response section, you can click on the View All Lead Categories Analytics button to check the detailed lead stats.
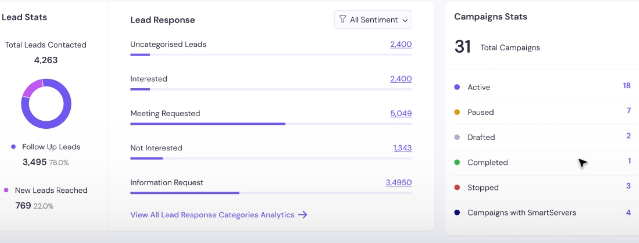
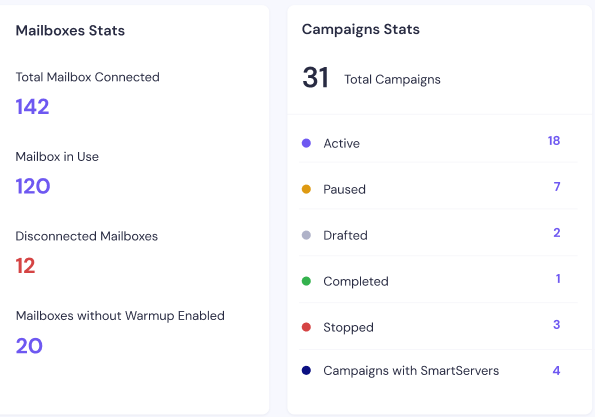
You get an overview of the campaign statuses in the Campaign Stats section. You get an overview of the number of Active, Paused, Drafted, Completed, Stopped, and Campaigns with SmartSenders.
The next section is Mailbox Stats where you get a glance on how many mailboxes are connected, mailboxes in use, disconnected mailboxes, and Mailboxes without warmup enabled.
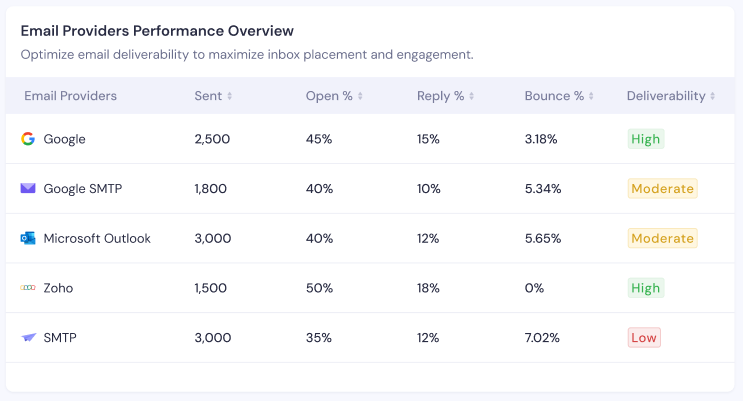
Now, in the Email Providers Performance Overview section where you can check email performance from an email provider level. You can check the total number of emails sent, open rate, reply rate, bounce rate, and deliverability status. You can essentially sort the results in ascending or descending order as well.
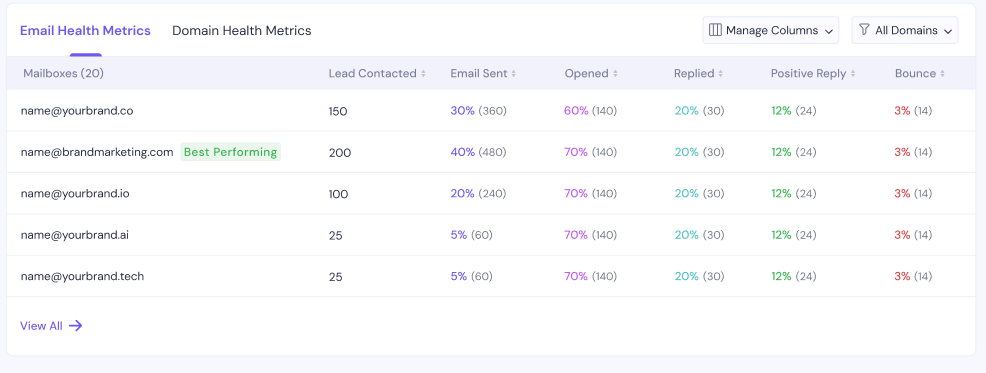
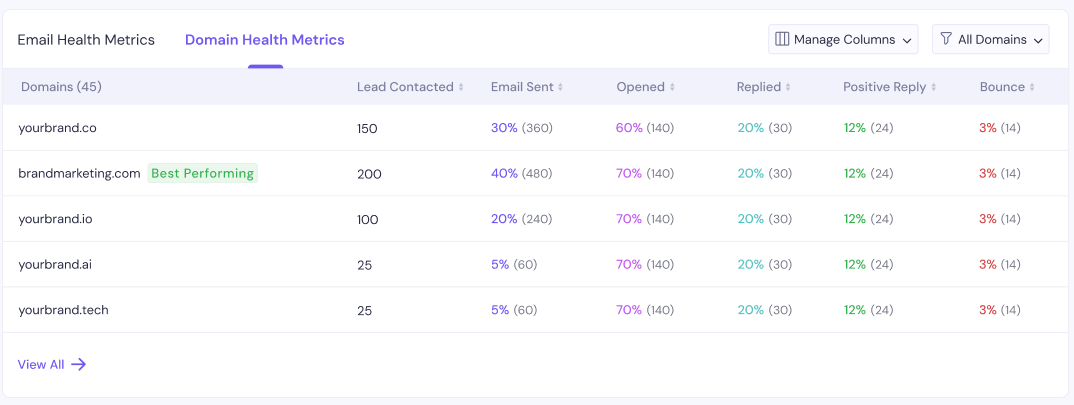
If you need further breakdown of your email performance, the next section Email Health Metrics and Domain Health Metrics will give you a detailed breakdown.
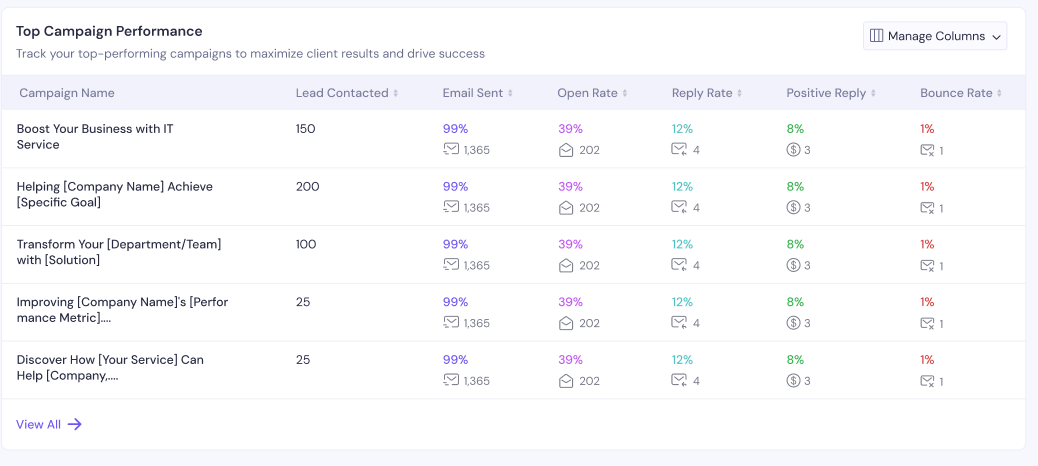
The next section is “Top Campaign Performance” where you can check campaign level performance metrics like the number of leads contacted, emails sent, open rates, reply rates, positive replies, and bounces.
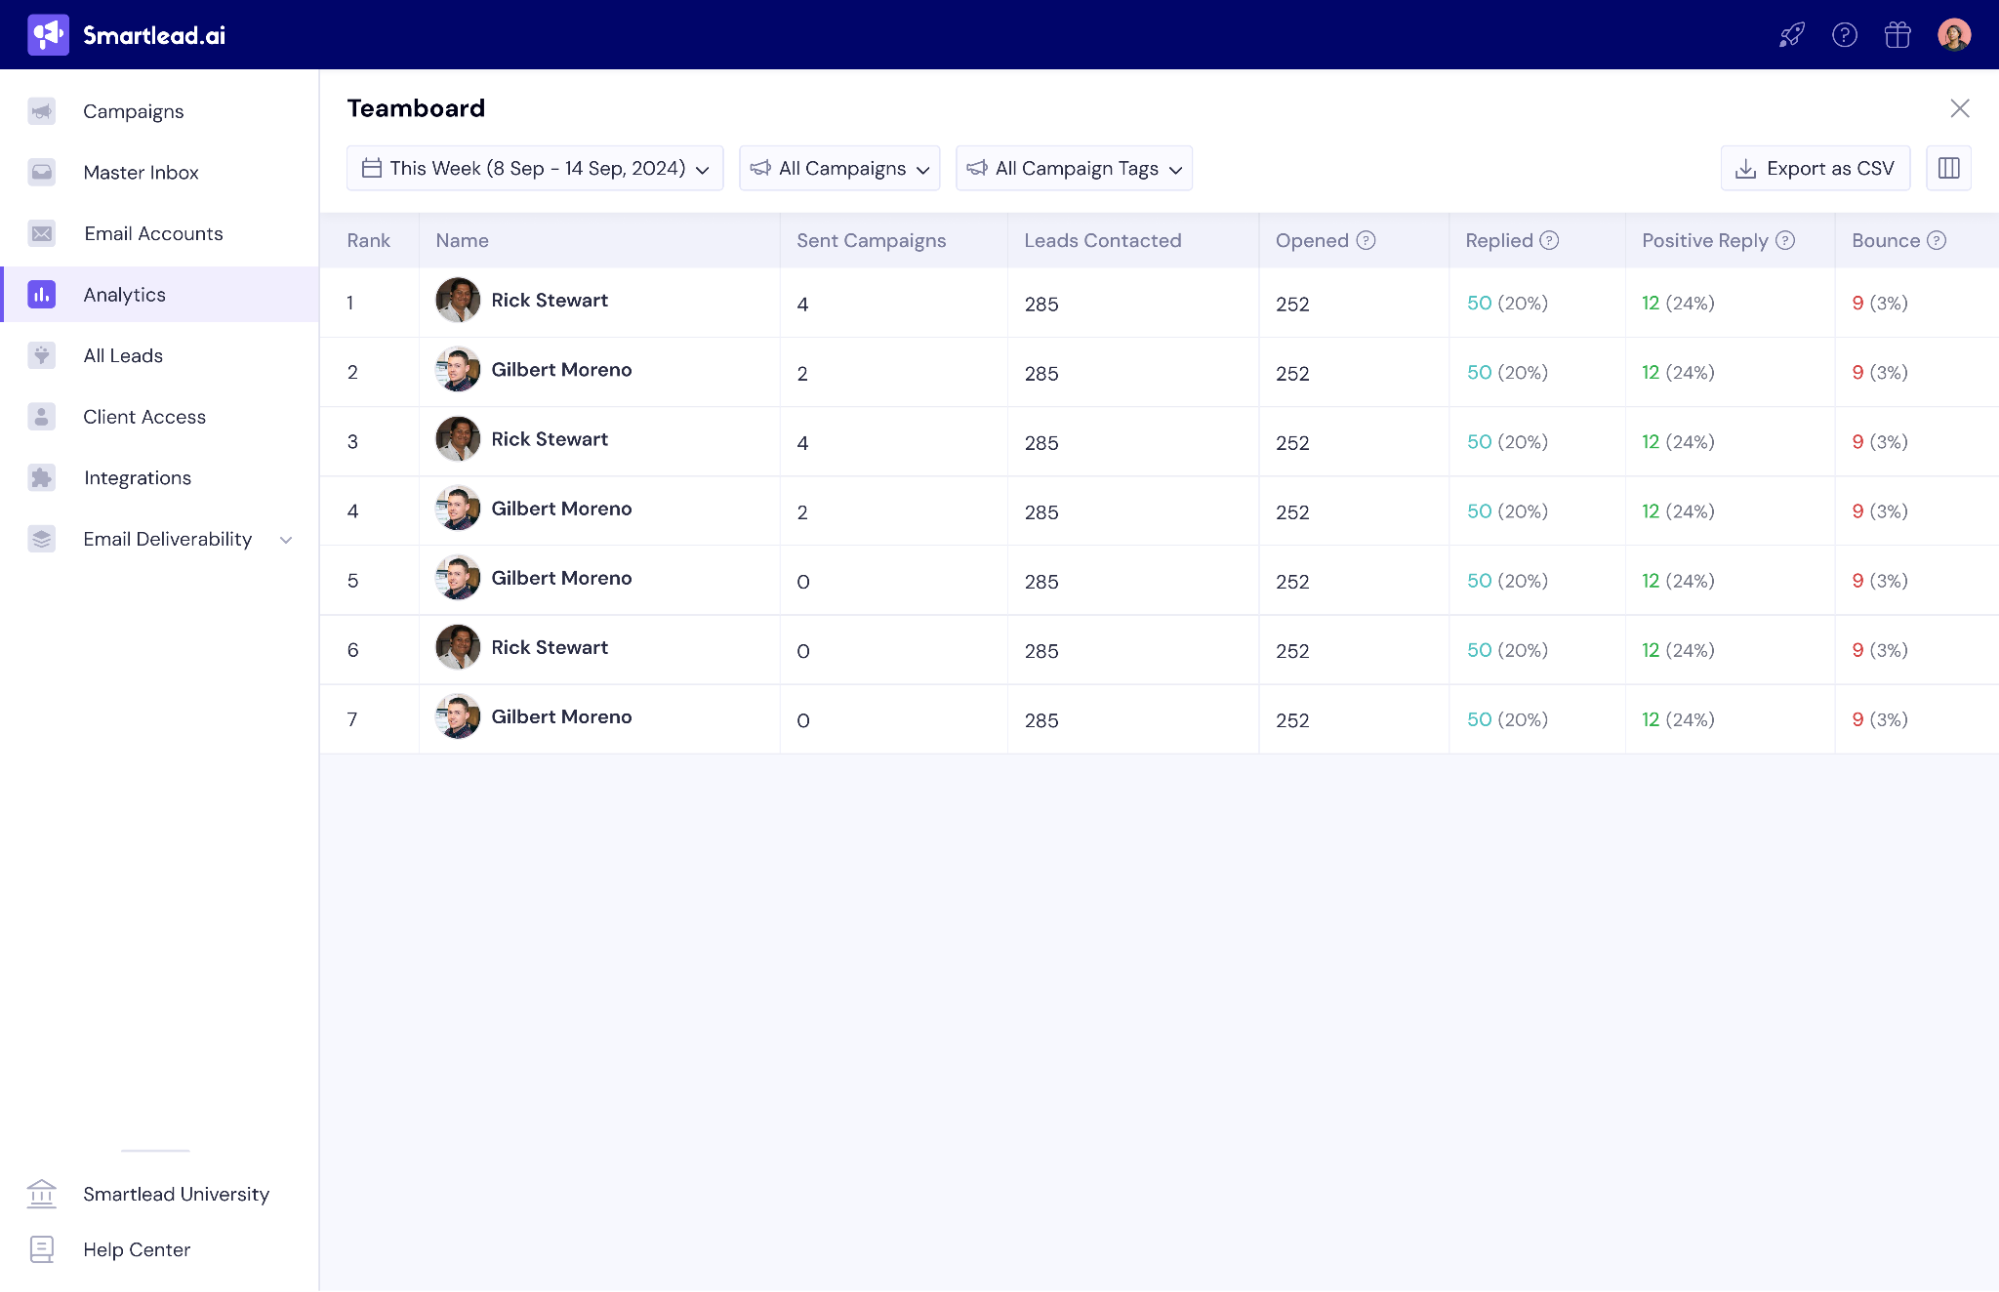
The next section is Teamboard, where you can check the performance of team members. It can be helpful for Agencies and teams with multiple members working on projects.
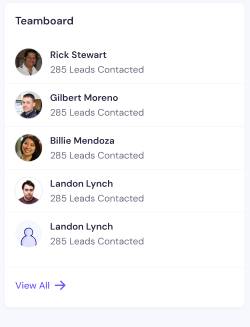
Once you click on the View All, you can get a detailed view of the Teamboard.
The next section is Campaign Wise Response Analysis will give you an overview of all the replies you got and the sentiment around it – positive, negative, neutral, and uncategorized.
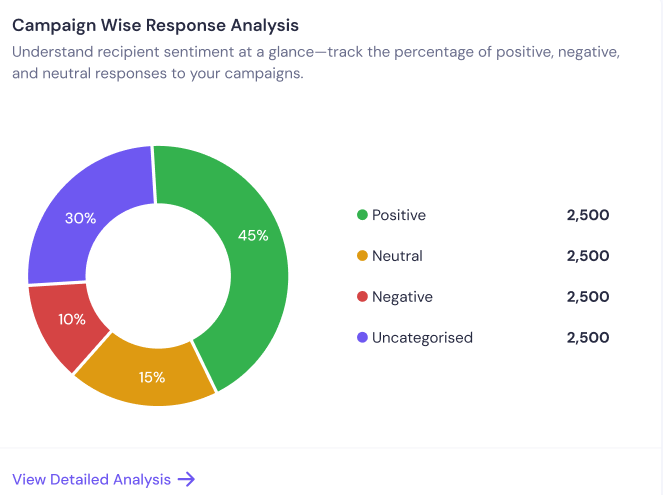
Once you click on the View Detailed Analysis, you can see detailed campaign level response analysis based on the replies you got.
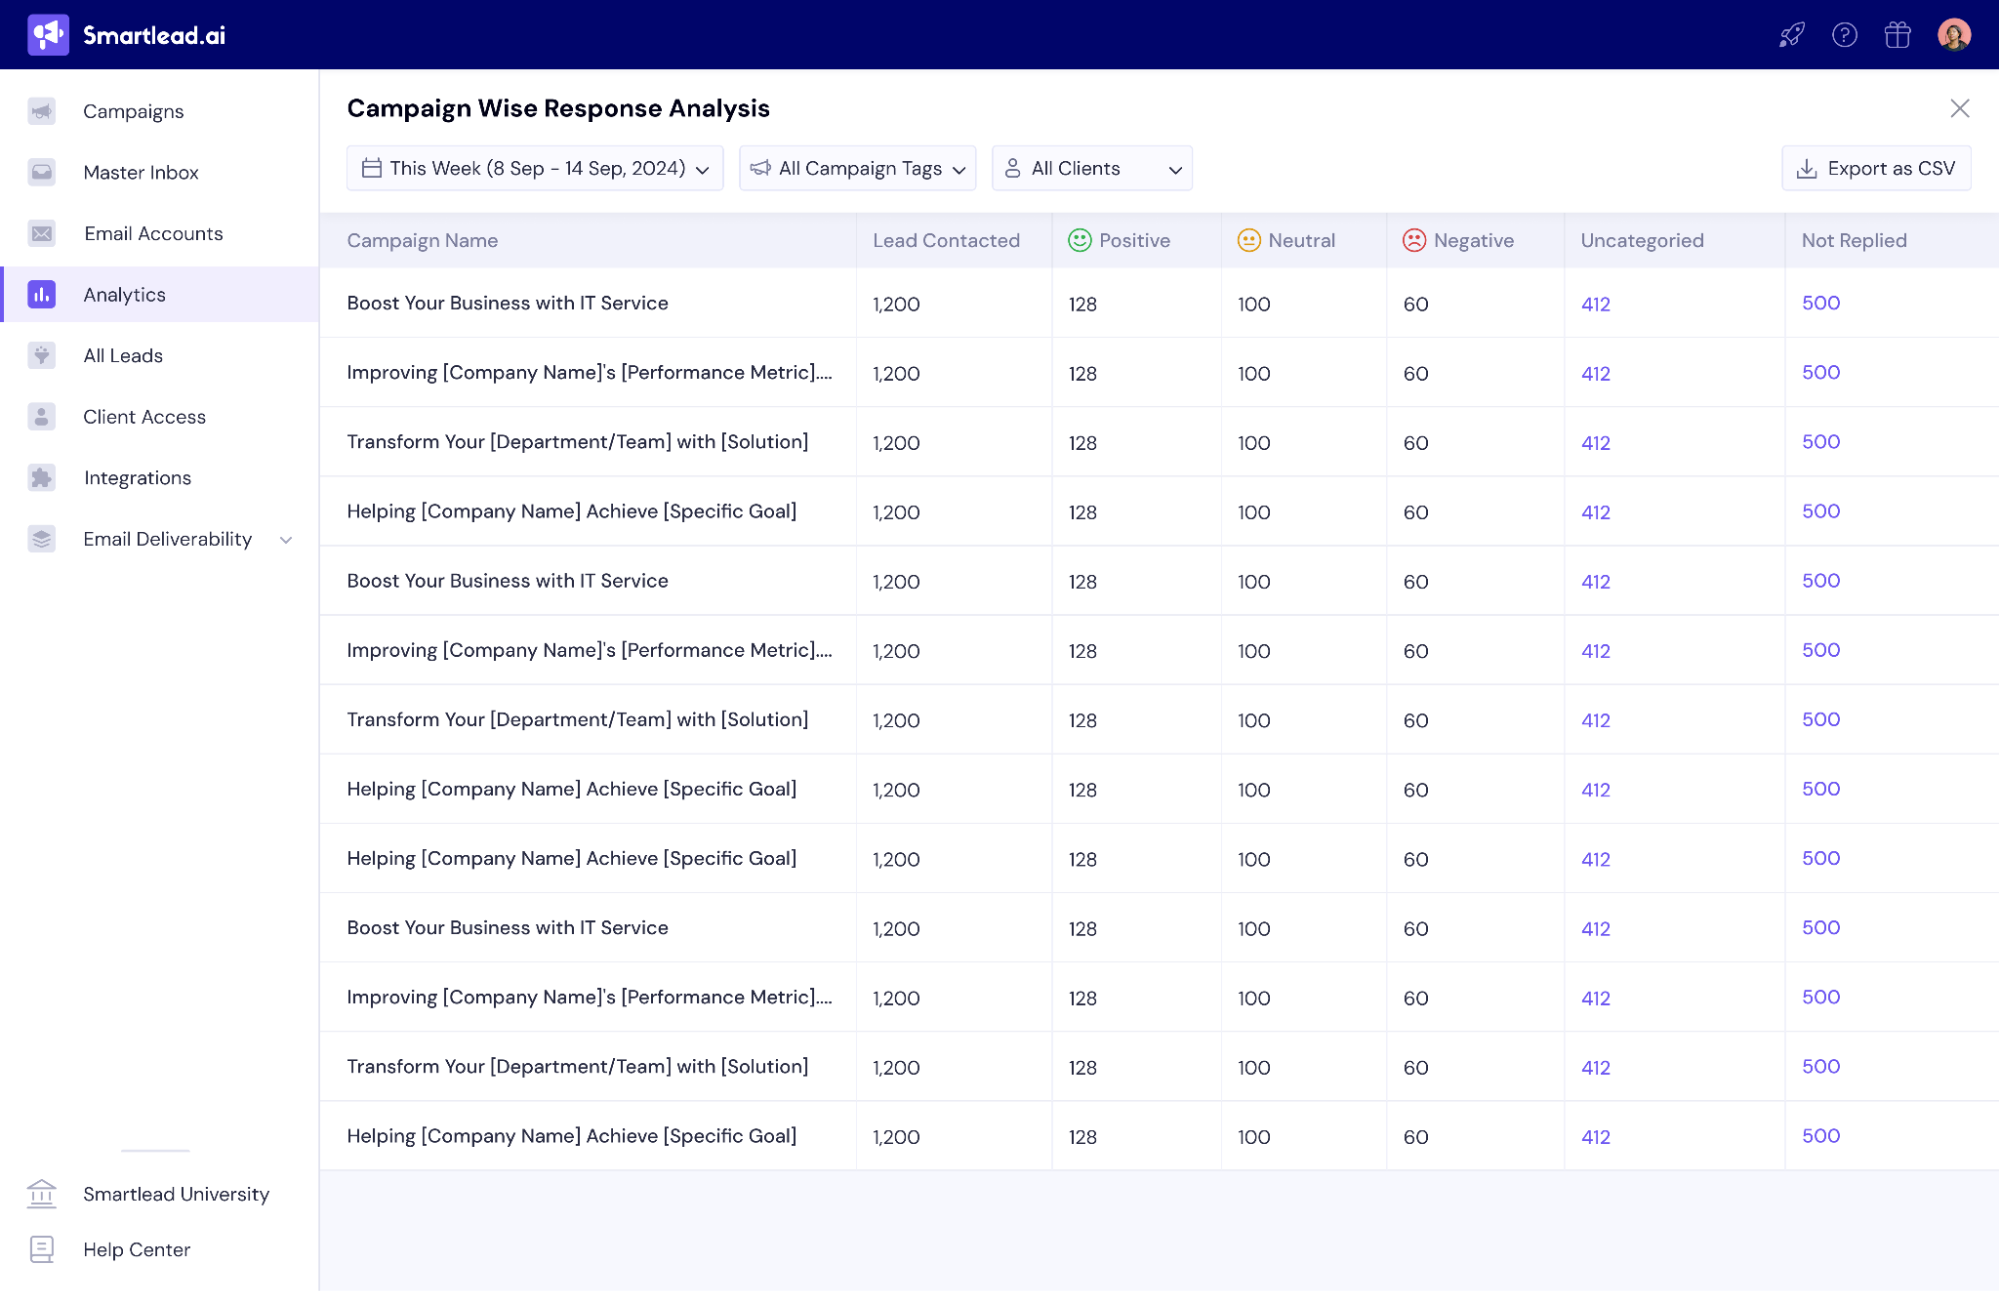
On the top right corner of the detailed Campaign Wise Response Analysis page, you get the option to download the CSV file for reports.
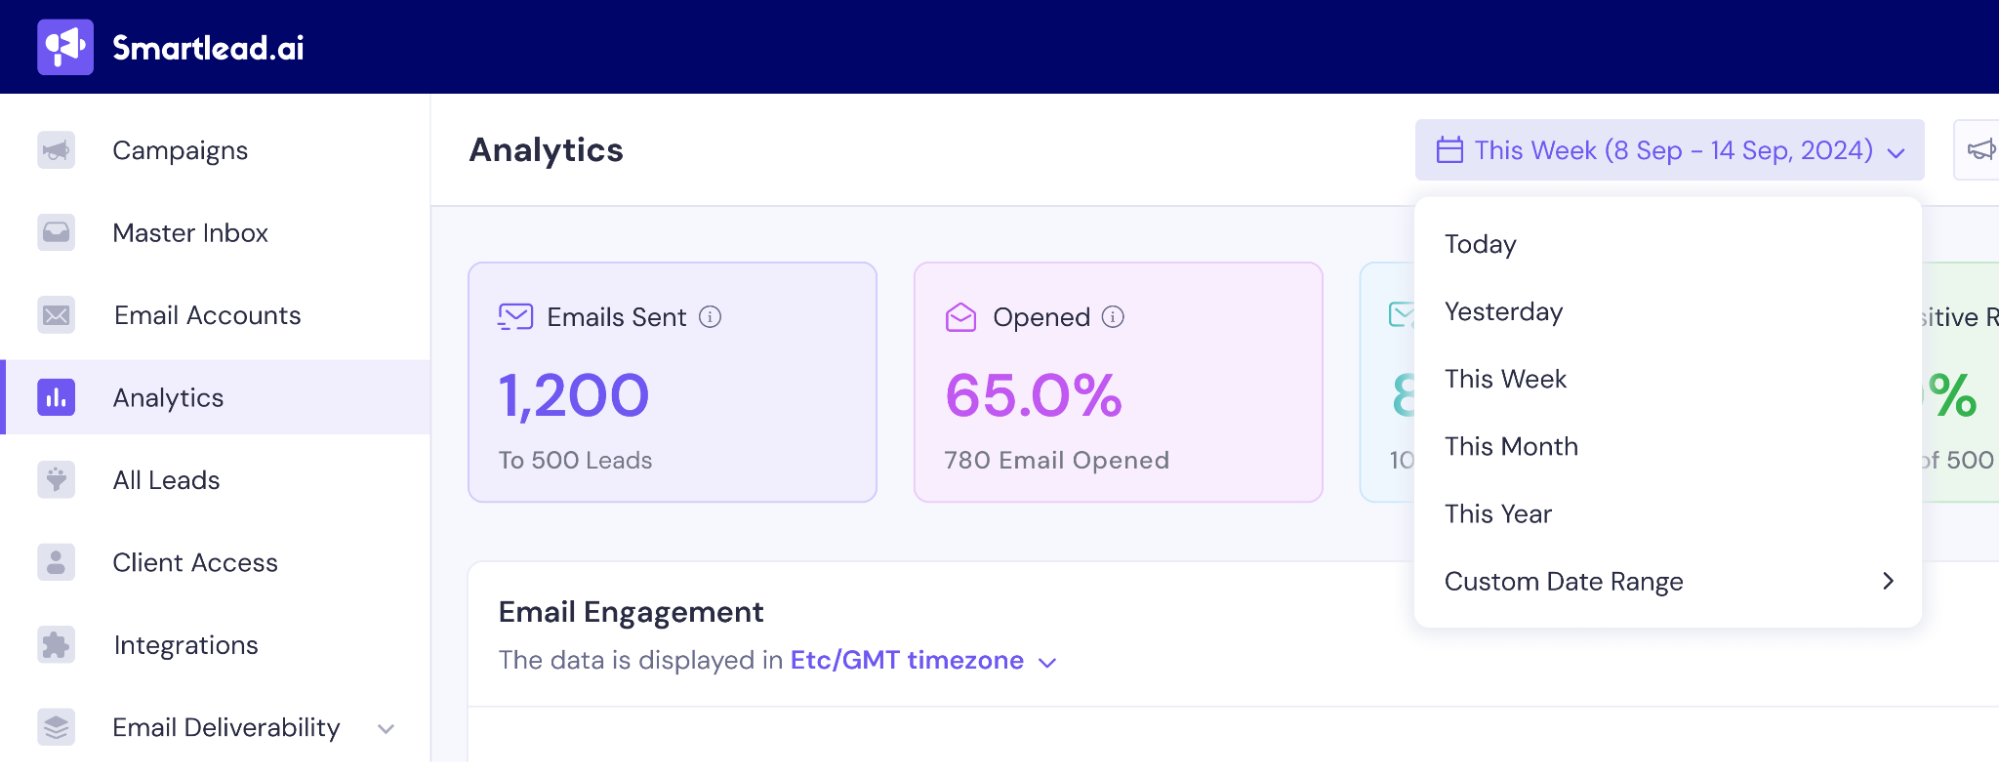
Now, coming to the Filters in Global Analytics for you to take control of your data.
Come to the Global Analytics page and
Extended Date Range: Analyze performance across 365 days instead of the previous 31-day limit.
Unlimited Campaign & Client Tracking: No restrictions on how many campaigns or clients you can analyze at once.
Advanced Filters:
Filter by campaign status (active, paused, completed, etc.)
Segment by lead response type (positive, neutral, negative)
Sort data in ascending or descending order to quickly identify trends
ESP-level filtering to analyze provider-specific performance
Yes, the old Global Analytics dashboard will remain available until Phase 2 is fully released. Users can switch between the old and new versions during this transition.
Use the date filter at the top of the dashboard to select any range up to 365 days.
The Agency Insights Dashboard allows teams managing multiple clients to track account health, identify underperforming clients, and make data-driven decisions in real-time.
Yes, all reports can be exported as CSV files for external analysis.
Use the Email Providers Performance Overview to compare ESP results and adjust your sending strategy accordingly.