
The Analytics tab in SmartDialer shows how your calling program is performing: how many calls you're making, how many connect, and how your dialer credits are being used.
Go to the SmartDialer section in the left sidebar (Engage tab > Calls), then click the Analytics tab.
At the top, filter what you're viewing by:
Date range (e.g. Last 30 days)
Number (e.g. All numbers, or a specific number your workspace owns)
This guide covers:
Summary stat cards
Total calls chart
Calls by Disposition status and Calls by Tags
Available credits and Dialer Credit Utilization
1. Summary Stat Cards
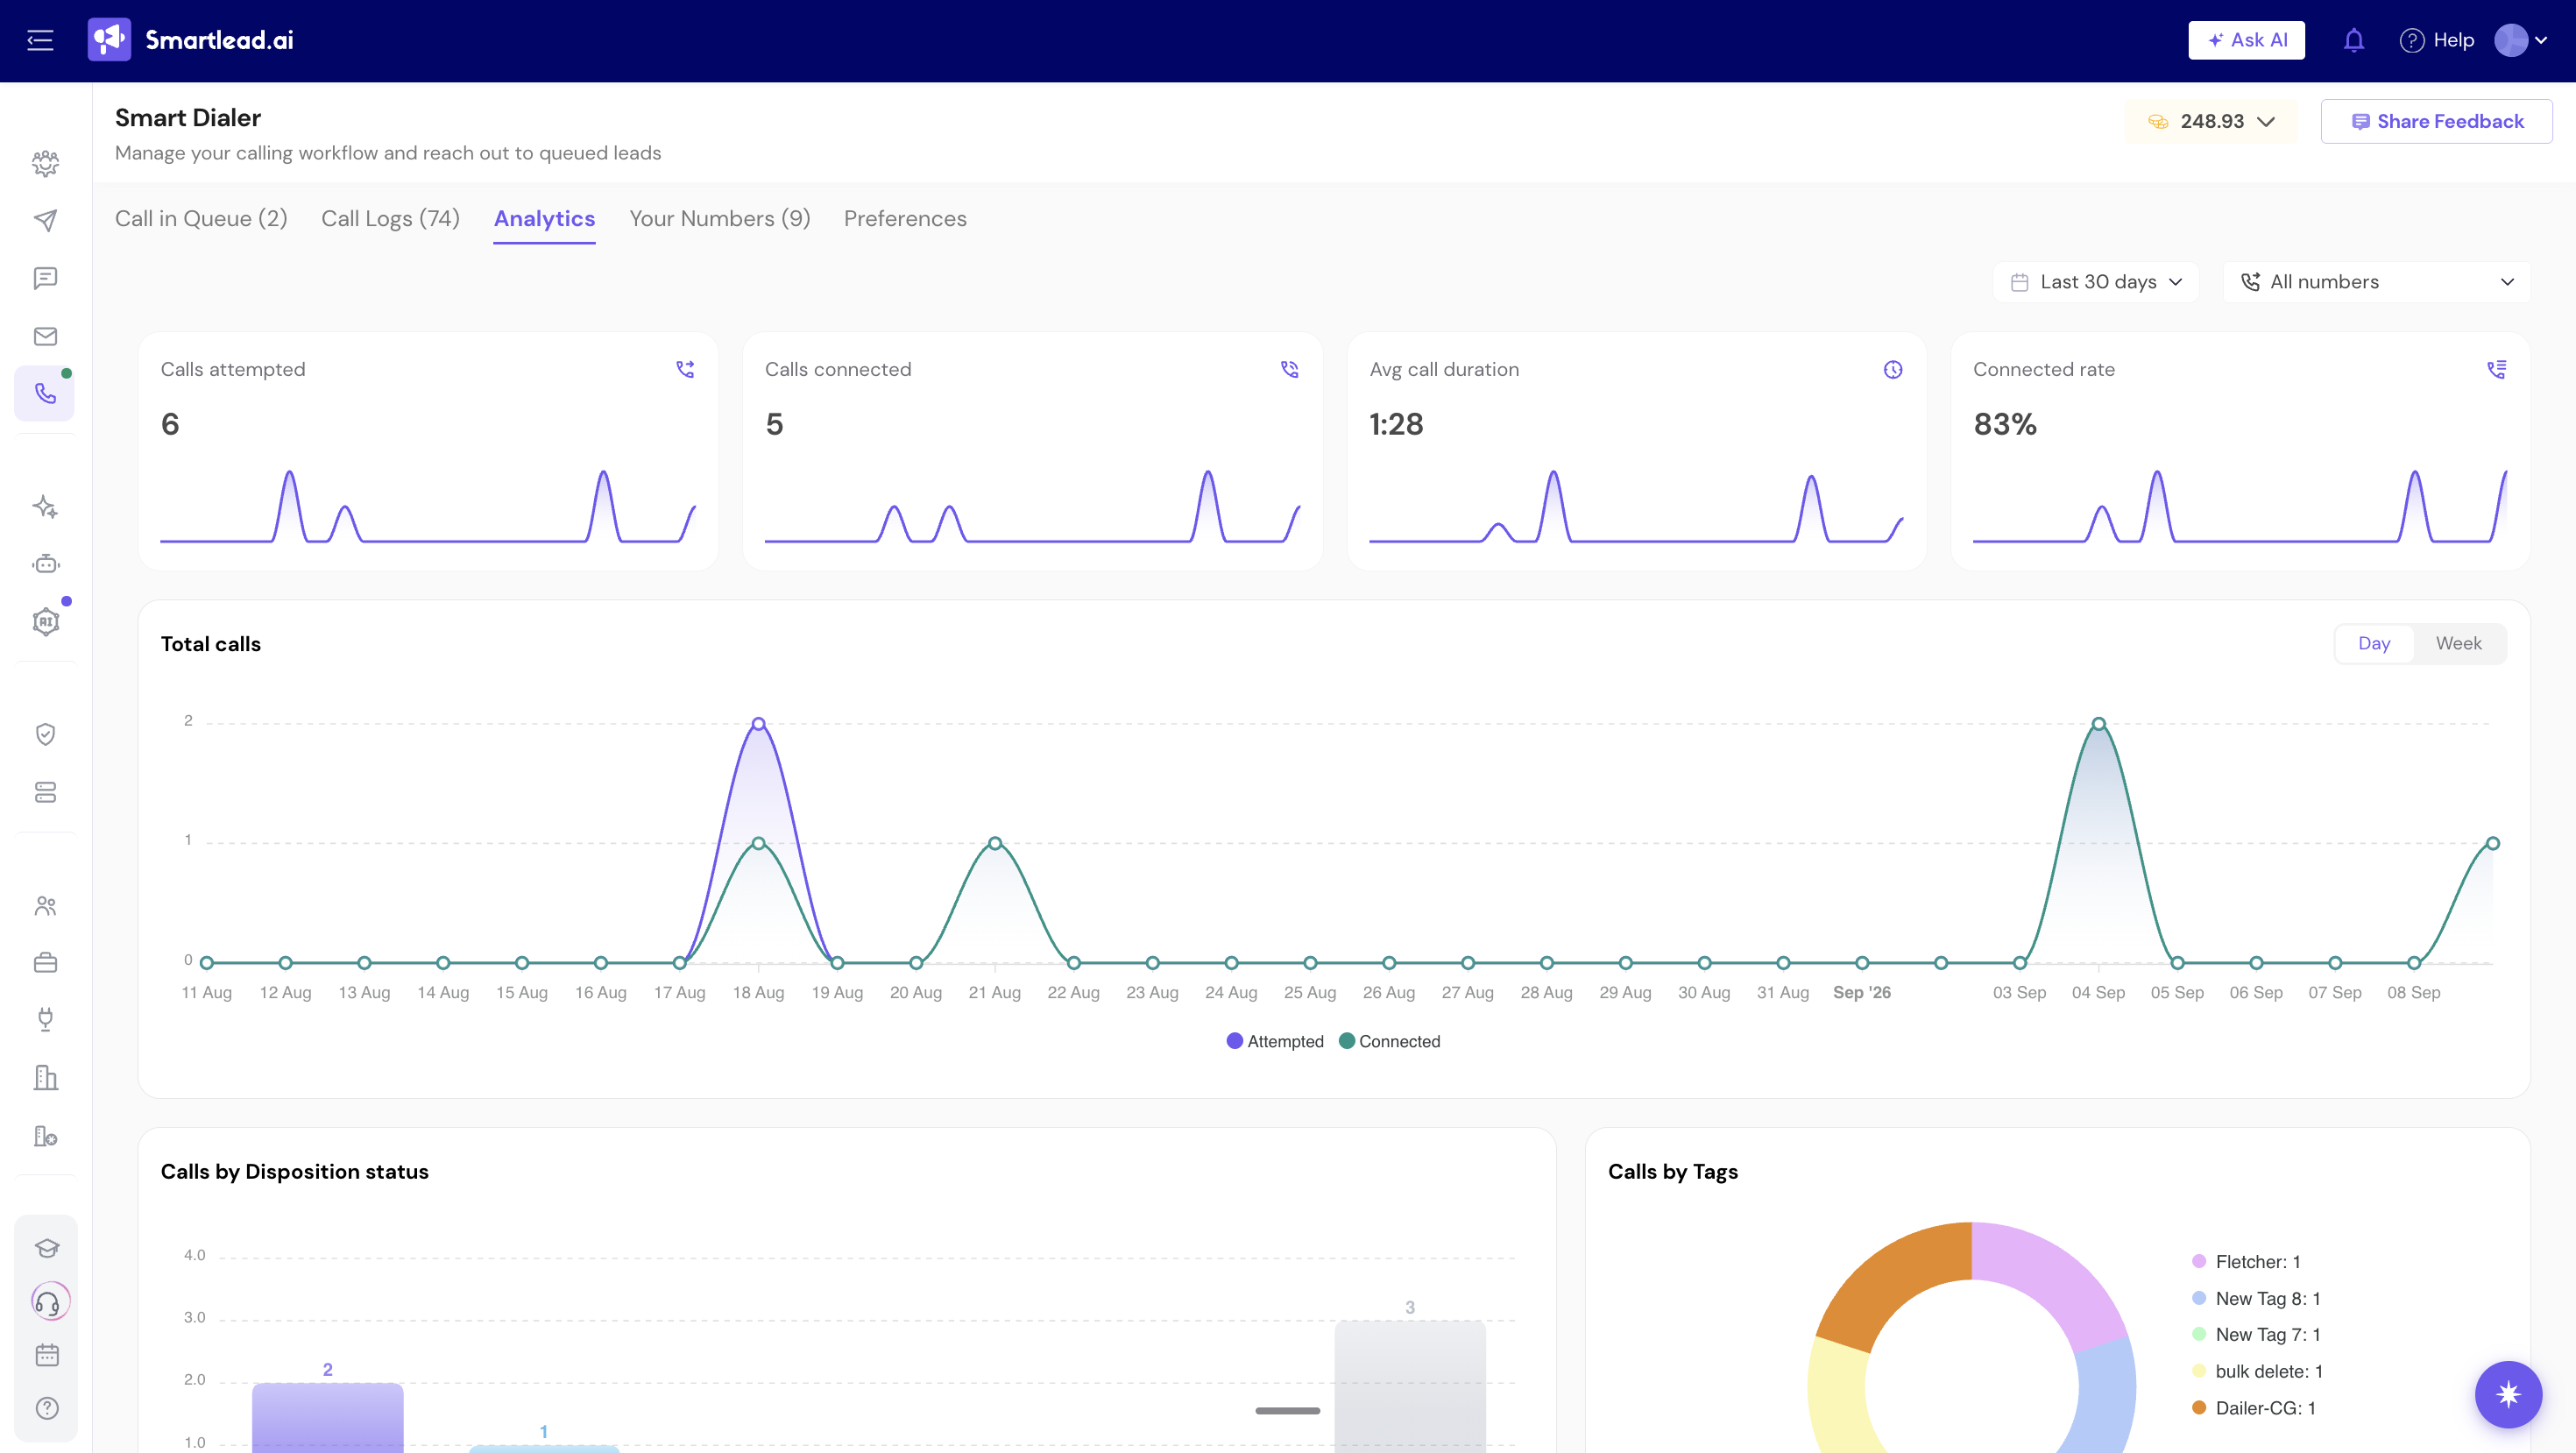
Four cards at the top summarize your selected date range, each with a trend sparkline:
Calls attempted - total calls placed
Calls connected - calls that reached the other party
Avg call duration - average length of connected calls
Connected rate - the percentage of attempted calls that connected
2. Total Calls Chart
The Total calls chart plots Attempted calls against Connected calls over time.
Use the Day / Week toggle above the chart to switch the time granularity.
3. Calls by Disposition Status and Calls by Tags
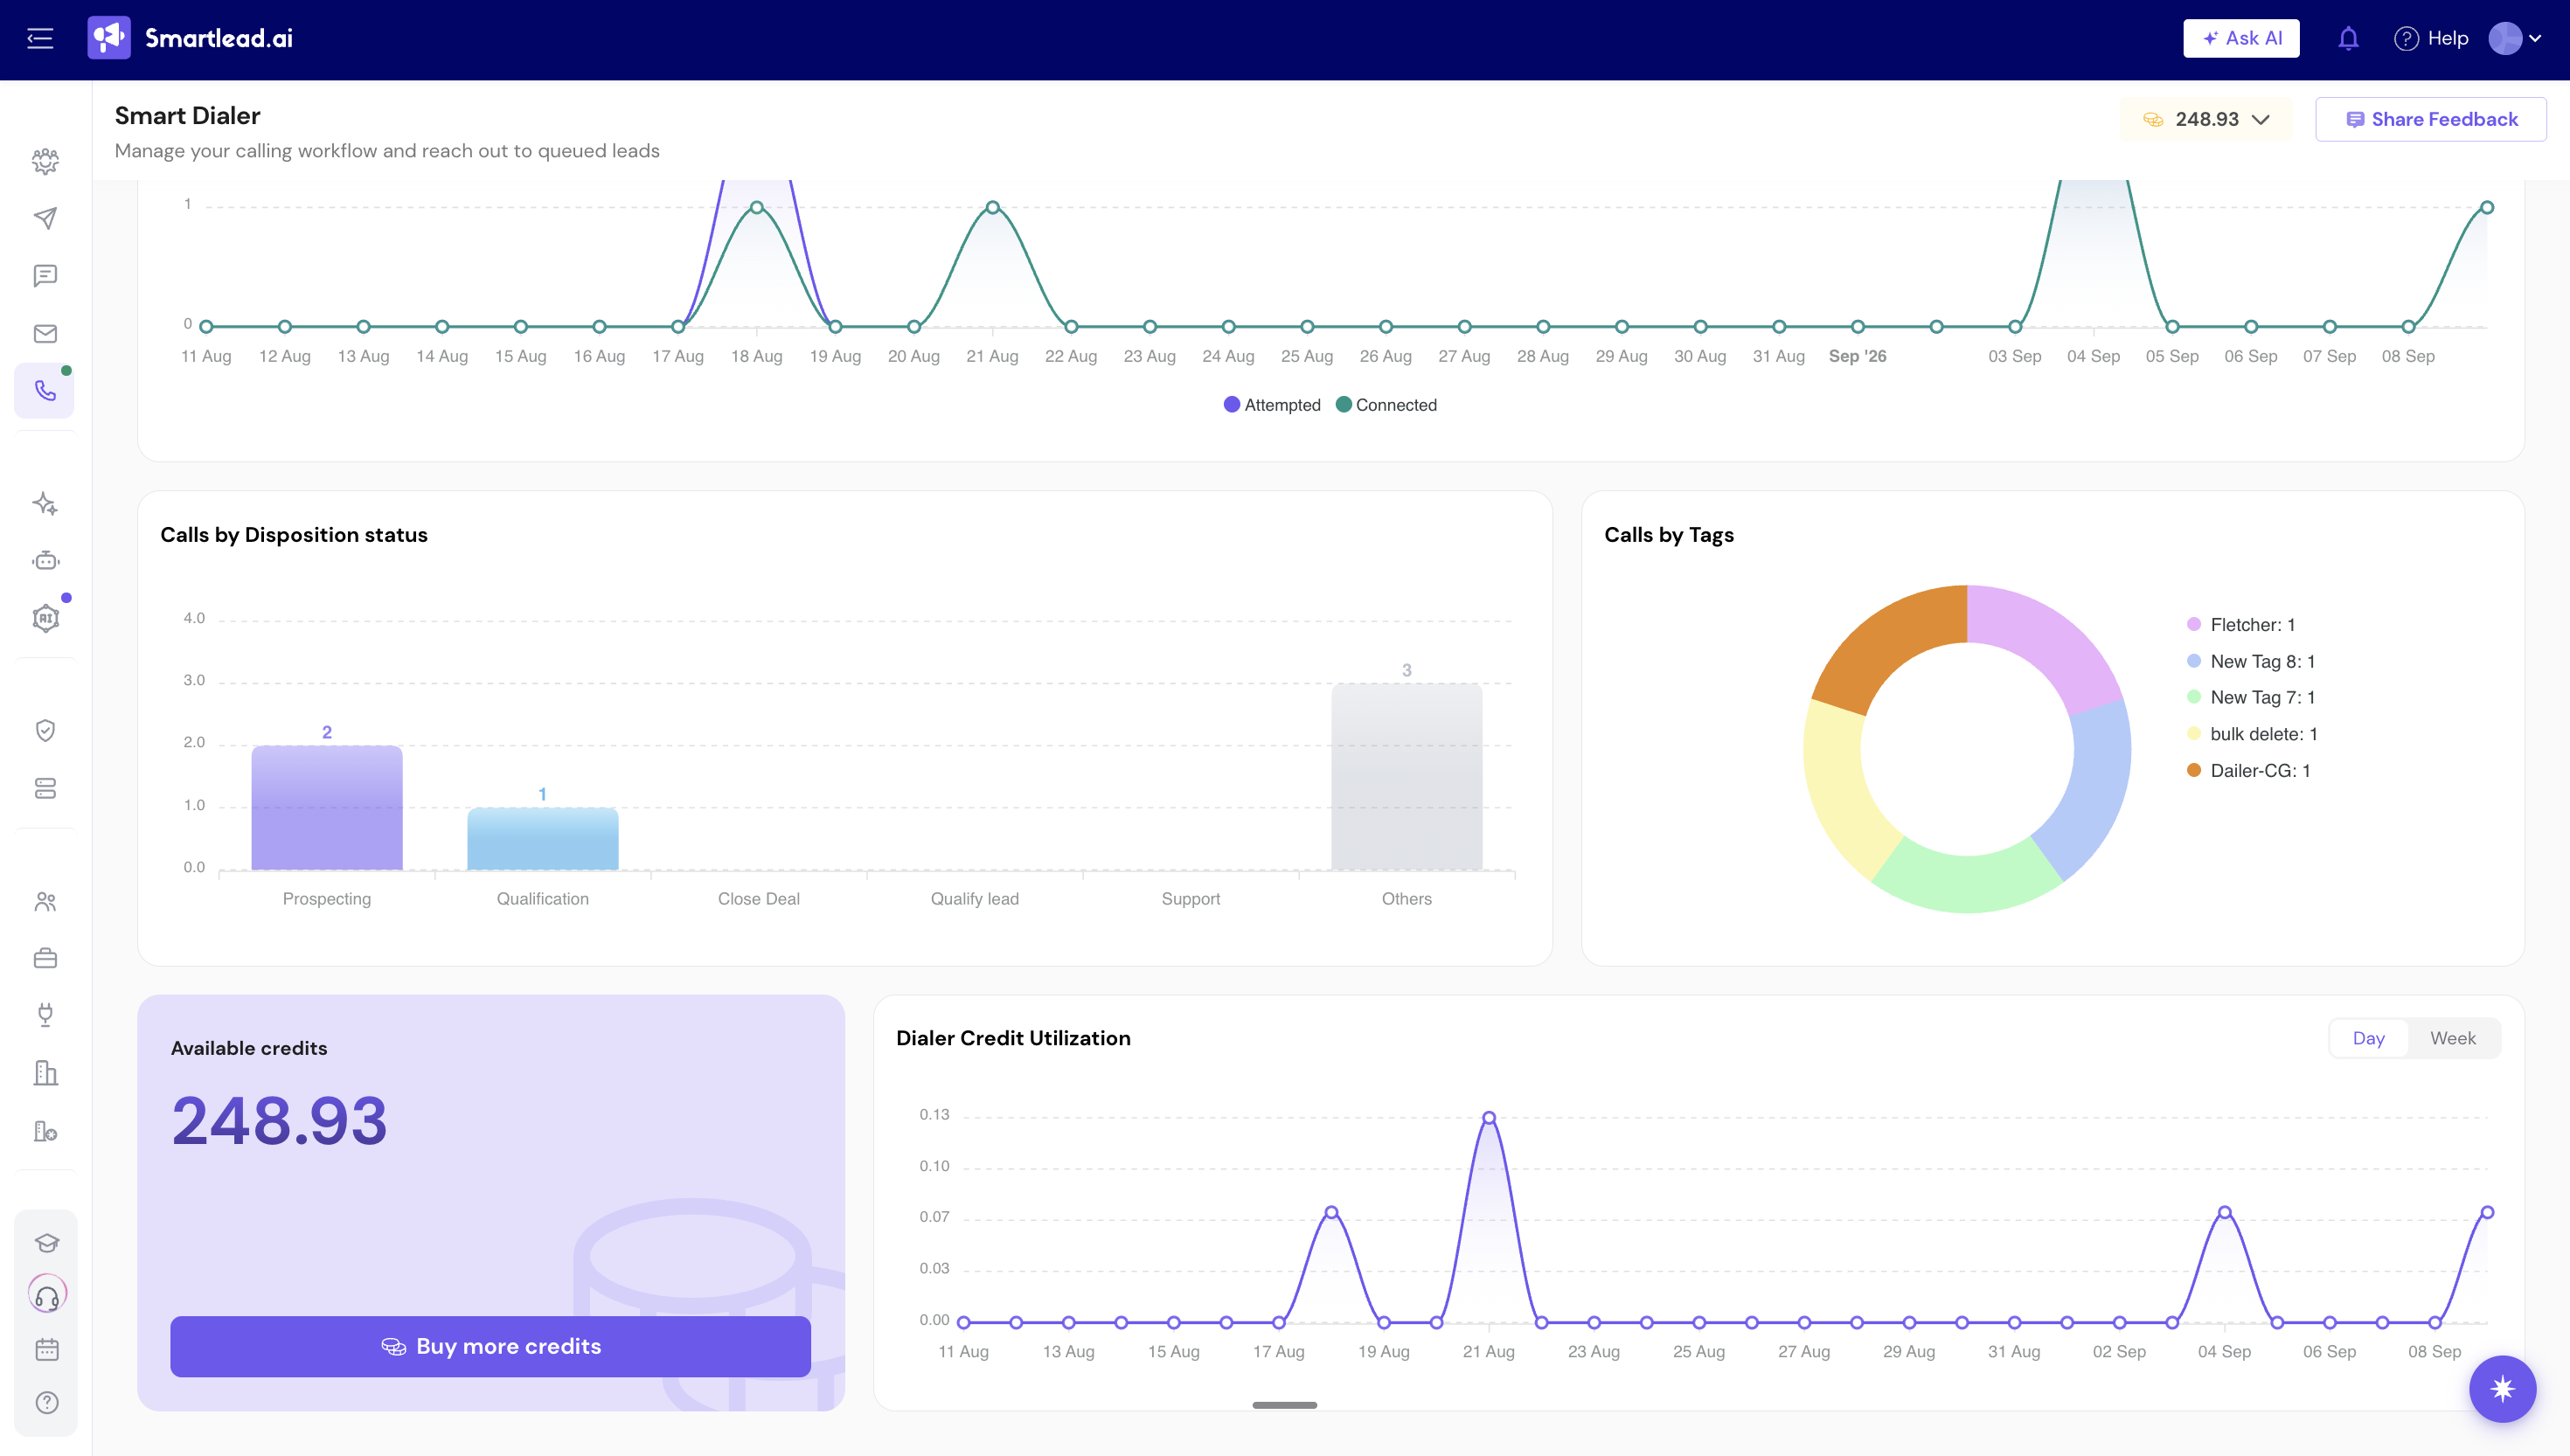
Calls by Disposition status - a bar chart showing your logged calls grouped by purpose (e.g. Prospecting, Qualification, Close Deal, Qualify lead, Support, Others)
Calls by Tags - a donut chart showing your logged calls grouped by the tags you've applied, with a legend listing each tag and its count
Purpose and tags come from what you log after each call. See: How to Call a Lead from Master Inbox (Section 4: After the Call Ends) for how to log them.
4. Available Credits and Dialer Credit Utilization
Available credits shows your current dialer credit balance, with a Buy more credits button to top up
Dialer Credit Utilization is a chart showing how your credits have been spent over time, with the same Day / Week toggle as the Total calls chart
For the full walkthrough of the rest of the SmartDialer section (Call in Queue, Call Logs, Your Numbers, Settings), see: Exploring SmartDialer: Call Queue, Logs & Numbers.